Faster startup times in java
Having “solved” a strange issue, I was happy that my tool started up in about 1 second instead of 6 seconds. But then, my ambition awoke and I wanted to see if it could be done better.

The tool basically reads some configuration files and starts up a jetty server. The server is used either as a proxy or to serve mock files from the local file system.
Optimizing without measuring is like fortune-telling. So with the help of some System.outs and using JProfiler, I tried to find performance bottlenecks and fix them. Here’s the result of it.
Logging
I use Logback as logging framework. It’s nice and simple and has some cool features. But its startup time is around 200ms, used amongst other things to read its configuration XML file. This is not much for a server application, but noticeable for a command line tool. So I changed it and used SLF4J’s SimpleLogger. It’s configured by system properties, so instead of a logback.xml file, there is a configuration class:
class LogConfigurer {
    public static void config() {
        System.setProperty(SimpleLogger.DEFAULT_LOG_LEVEL_KEY, "debug");
        setLogLevel("org.eclipse.jetty", "warn");
    }

    private static void setLogLevel(String prefix, String level) {
        System.setProperty(SimpleLogger.LOG_KEY_PREFIX + prefix, level);
    }
}
And indeed, startup was about 200ms faster.
Stopping a running server
Before starting the server, the tools tries to stop an already running server on the configured port. This is done by sending the following HTTP request: localhost:port/@@@proxy/stop. If a server is running on this port, it will stop itself. Otherwise we get a connection refused error that we simply ignore.
Surprisingly this simple request to localhost took around 300ms. Way too much for my liking. I used apache http components to send HTTP requests. It also has quite some startup overhead, for example to prepare SSL connections. So I switched to JDK’s HttpUrlConnection. But it was not really faster. A more exact analysis revealed that most time was used with processing the request on the server. Both HTTP libraries wait for the server’s response, which in this case is not needed and takes a lot of time. So I simply used a Socket to send the request and ignore whatever response might come back:
public static void stopServer(int port) {
    try (final Socket socket = new Socket("localhost", port)) {
        final Writer out = new OutputStreamWriter(socket.getOutputStream());
        out.write("GET /@@@proxy/stop\r\n\r\n");
        out.flush();
    } catch (IOException e) {
        //ignore
    }
}
This saved around 200ms.
Initialize ObjectMapper
The tool outputs some data in JSON format. To produce JSON, Jackson is used. Jackson also takes some time to initialize. This could be saved by lazily initializing it:
private ObjectMapper mapper;

private ObjectMapper getMapper() {
    return mapper == null ? mapper = new ObjectMapper() : mapper;
}

public String formatUsage(String key, Usage usage) throws IOException {
    return getMapper().writeValueAsString(createUsageData(key, usage));
}
This saved not as much as I hoped, but helped a lot together with the next improvement.
Asynchronously preinitialize ObjectMapper
Not only my code uses Jackson, but also REST-assured, which I use to work with JSON schemas. I cannot change their code, but I saw that there is a lot of time spent in <cinit> (class init) blocks. So executing this code before it’s used by REST-assured should improve the startup time, right?
final Thread initMapper = new Thread(new Runnable() {
    public void run() {
        new ObjectMapper();
    }
});
initMapper.setDaemon(true);
initMapper.start();
It was just an experiment and I was not sure if it would help anything… But it saved almost 100ms. Cool thing.
Start jetty asynchronously
Surprised by this success, I tried to find more things to preload asynchronously. A natural choice was the jetty server.
private final BlockingQueue<Server> serverProducer = new ArrayBlockingQueue<Server>(1);

final Thread initJetty = new Thread(new Runnable() {
    public void run() {
        serverProducer.add(new Server(options.getPort()));
    }
});
initJetty.setDaemon(true);
initJetty.start();

//do all the other stuff

server = serverProducer.take();
This brought around 50ms.
Initialize SSL asynchronously
One more thing that’s relatively expensive to initialize are SSL connections with their security infrastructure. So I tried the same trick here.
final Thread initSsl = new Thread(new Runnable() {
    public void run() {
        final SslContextFactory factory = new SslContextFactory();
        try {
            factory.start();
        } catch (Exception e) {
            //ignore
        }
        factory.newSSLEngine();
    }
});
initSsl.setDaemon(true);
initSsl.start();
Again a win of 50ms.
Lazy initialize REST-assured
I already preinitialized ObjectMapper which is used by REST-assured. But why bother initializing REST-assured at startup? It’s enough to do it when the first request arrives. So I implemented lazy loading and the gain was a whopping 250ms.
But unfortunately, this leads to a worse user experience: Errors in schema files are not detected until the first request is sent. So this optimization probably won’t make it into production.
Cache parsed RAML files
The tool not only parses JSON schemas, but also RAML files. To avoid the problems of lazy loading, I tried to implement caching.
public Raml loadRaml(String name) {
    final File cache = cacheOf(name);
    if (!cache.exists(name) || isNewer(name, cache.lastModified())) {
        return parseAndSave(name);
    }
    try {
        return load(cache);
    } catch (IOException | ClassNotFoundException e) {
        return parseAndSave(name);
    }
}

private Raml parseAndSave(String name) {
    final Raml raml = parse(name);
    save(raml);
    return raml;
}

private void save(Raml raml) {
    try (final ObjectOutputStream oos = new ObjectOutputStream(new FileOutputStream(cacheOf(raml)))) {
        oos.writeObject(raml);
    } catch (IOException e) {
        //ignore
    }
}

private Raml load(File file) throws IOException, ClassNotFoundException {
    try (final ObjectInputStream ois = new ObjectInputStream(new FileInputStream(file))) {
        return (Raml) ois.readObject();
    }
}
Unfortunately, this helped nothing. Seems that object serialization is not much faster than parsing RAML files. But I only tested with a minimal RAML file. So it could look different with bigger files. Or with RAMLs that include a lot of other RAMLs.
Overview
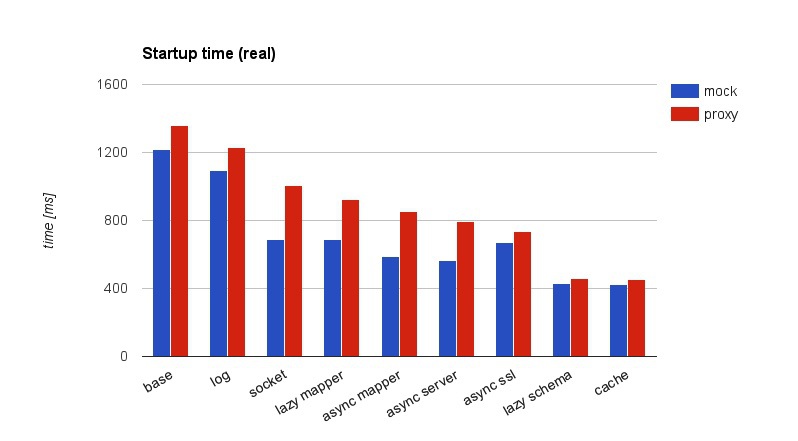
Every improvement brings down the startup time. The only exception is async SSL for mock because in mock mode, SSL is never used.
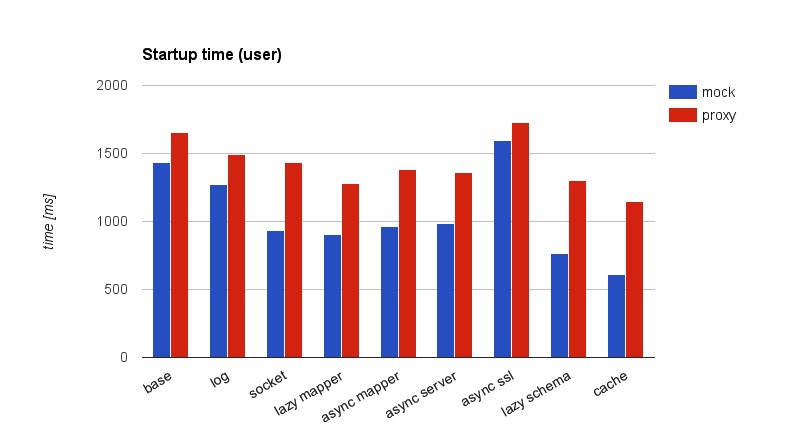
User time can be longer than real time because it’s the time spent by all CPU cores together. The async improvements need more CPU time while the real time shrinks. This means, more work is done in parallel. While caching is not improving real time, it needs less CPU time. So is the RAML parser doing stuff in parallel?
Conclusion
The startup time could be diminished from 1.2 to 0.4 seconds. The tools starts now in a third of the original time. This is not too bad.
Of the different used techniques, the asynchronous preloading is surely the most interesting. First because I never used it before and, more importantly, because CPUs become more and more parallel so software must be adjusted to this style in order to profit from faster hardware.
Another question is whether java is suited to write command line tools in it. Clearly, there are other environments that are more popular for this kind of task like node.js, go or still C. And many java libraries are designed with big server applications in mind, where initialization times of several 100ms are tolerable.
But with the right libraries, awareness for the issue and some tricks, it’s absolutely possible to write usable and fast command line tools in java. And with the advent of microservices and things like spring boot, the java world might become more sensitive to startup times.